Andy White Anthropology
  • Home
  • Research Interests
    • Complexity Science
    • Prehistoric Social Networks
    • Eastern Woodlands Prehistory
    • Ancient Giants
  • Blog
  • Work in Progress
    • The Kirk Project >
      • Kirk 3D Models list
      • Kirk 3D Models embedded
      • Kirk 2D images >
        • Indiana
        • Kentucky
        • Michigan
        • Ontario
      • Kirk Project Datasets
    • Computational Modeling >
      • FN3D_V3
    • Radiocarbon Compilation
    • Fake Hercules Swords
    • Wild Carolina >
      • Plants >
        • Mosses
        • Ferns
        • Conifers
        • Flowering Plants >
          • Grasses
          • Trees
          • Other Flowering Plants
      • Animals >
        • Birds
        • Mammals
        • Crustaceans
        • Insects
        • Arachnids
        • Millipedes and Centipedes
        • Reptiles and Amphibians
      • Fungi
  • Annotated Publications
    • Journal Articles
    • Technical Reports
    • Doctoral Dissertation
  • Bibliography
  • Data

Some Very Preliminary Kirk Morphometric Data

10/4/2016

14 Comments

 
I've spent some time over the last few days generating some basic morphometric data from the 3D models of Kirk points that I've processed so far (n = about 50) . I'd like to have about double that for a formal analysis to publish, but I also would like to discuss some preliminary results as part of my presentation at the SEAC (Southeastern Archaeological Conference) meeting that's coming up in a few weeks. So you go to war with the Kirk assemblage you've got, not the Kirk assemblage you want.

Before I talk about the data, I'd like to congratulate myself on having the forethought to take a day last spring to write down the workflow right after I got it figured out. There were a few details that I neglected to mention in that blog post, but overall it was a huge time saver. Figuring out the steps was enough of a pain-in-the-ass the first time. Let us never do it again.​

Picture
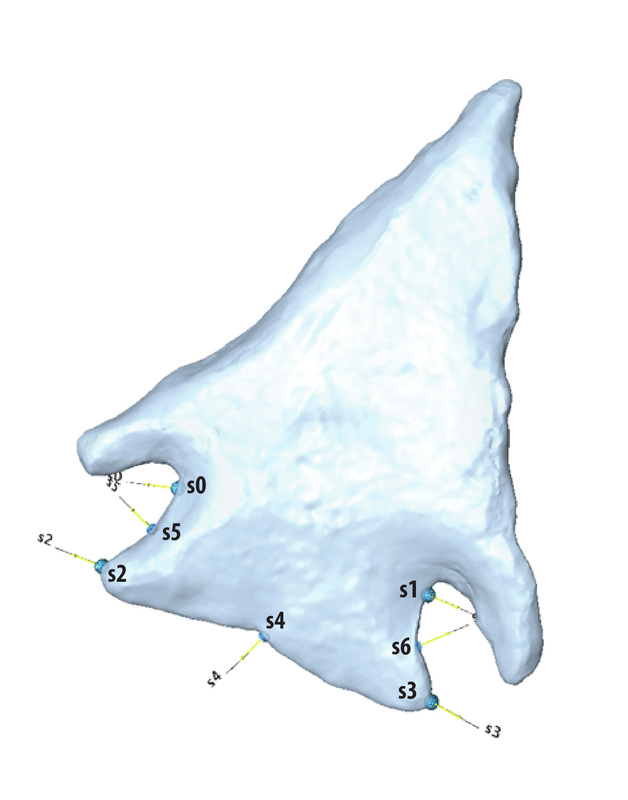
I defined seven landmarks on each point (s0 through s6).

​To define these landmarks consistently, I first oriented the point to minimize the horizontal distance between s0 and s1. Generally, that resulted in s0 and s1 falling on roughly the same plane. I then defined s2 and s3 to mark the maximum deviation of the lateral haft edges proximal to maximum constriction of the haft (marked by s0 and s1).  

Picture
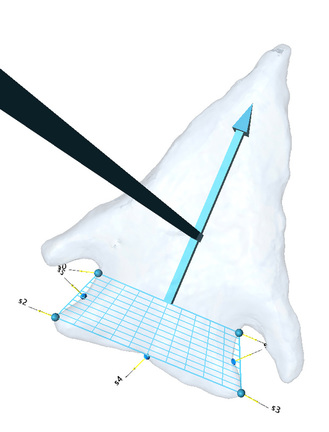
I used s0, s1, s2, and s3 to define the axial plane (in the "View" pulldown menu). This superimposes an asymmetrical grid on the point and defines a set of three planes: axial, coronal, and sagittal (named following conventions for anatomy, which is what this software was designed for). 

Picture
I turned on the sagittal plane to locate landmark s4. The sagittal plane splits the axial plane down the middle. Landmark s4 is defined as the location where the sagittal plane intersects with the basal edge of the point when the sagittal plane bisects the axial plane. If the point is symmetrical, s4 will fall in the center of the basal edge.

Note: the sagittal plane is movable. When you initially turn it "on," it's automatically centered in reference to the axial plane. If it gets moved you can recenter it simply by turning it off and then on again.

Picture
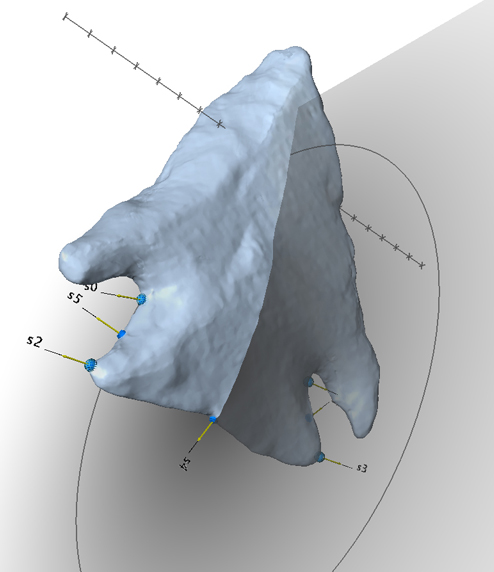
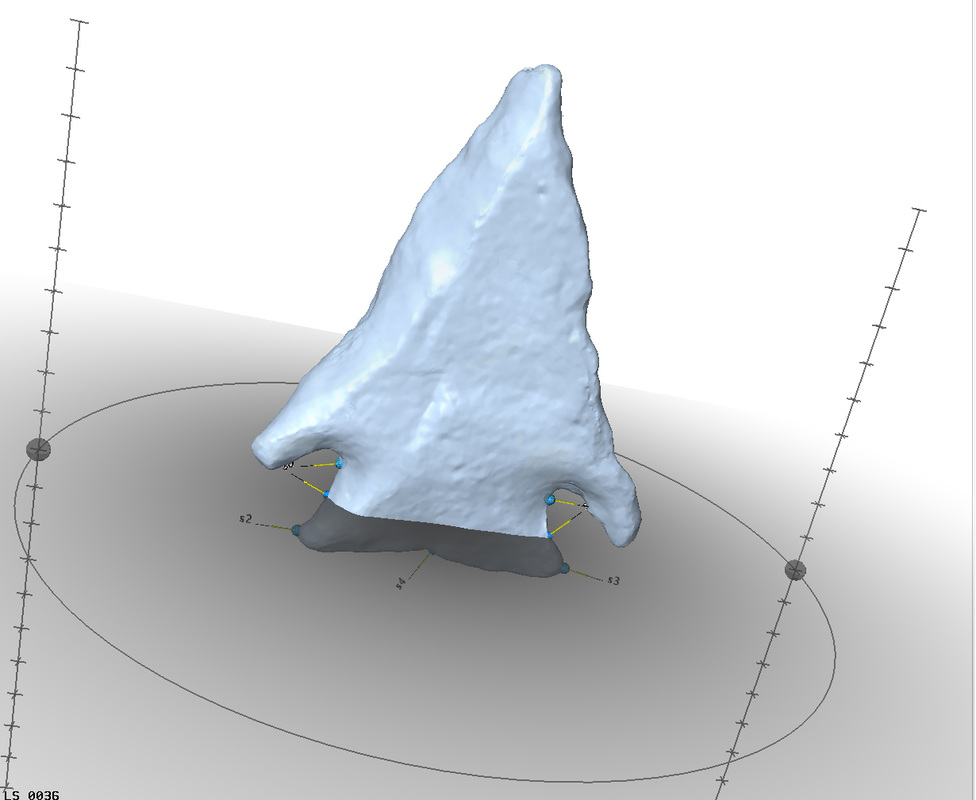
Finally, I turned on the coronal plane to locate landmarks s5 and s6. Landmarks s5 and s6 are defined as the locations were the coronal plane intersects the lateral edges of the haft when the coronal plane bisects the axial plane.

For each point, you have to tell the software how the landmarks correspond to those on the "atlas" model. The simplest thing to do is to always place the landmarks in the same order. You still have to manually define the correspondence between each model and the atlas ("View Correspondences" in the "View" menu).

I followed the same steps I described in the previous post to export and edit the data so that I could import it into MorphoJ. I used MorphoJ to perform a principal components analysis (PCA), the purpose of which is take all the variability in the 3D data and boil it down to its most important components. PCA lets you flatten the variability in a dataset into scores that you can plot in two dimensions.

Here are the basic results of the PCA performed on the points currently in the sample:
Picture
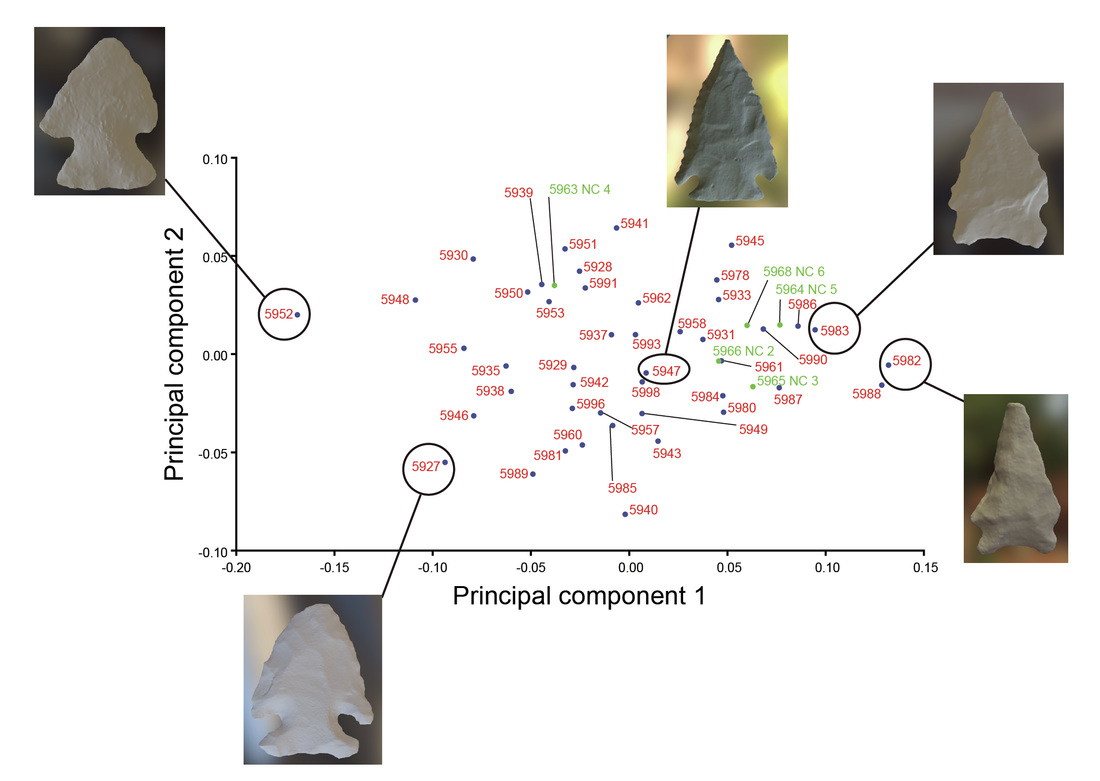
I haven't spent any significant time digging into the data yet, but my initial reaction is that the first principal component may well be measuring variability related to time. If you look at the examples of points that fall at the far left end of the plot, they look very Taylor- or Thebes-like, with relatively long hafts, deep notches, and small/shallow basal concavities/indentations separating broad convex basal edge segments. The points at the far right of the plot, conversely, have relatively short hafts, shallow notches, and broad basal concavities. If you squint a little, maybe, you can see how that end of the Kirk spectrum is trending toward a bifurcate/lobed haft morphology. In the center of the plot are points like 5947, which I think we can agree is a "modal" Kirk Corner Notched.

With the exception of the Nipper Creek cache points (shown in green), all the points in the sample are from Allendale County, South Carolina, and are made from Allendale chert. This all but eliminates the possibility that the variability is due to space or raw material.

My next step is to explore the possible "time" component of the PCA by gathering some data from the point forms that bracket Kirk: Taylor (on the earlier side) and lobed/bifurcate points (on the later side). If I'm correct that the first principal component shown above is telling us something about time, the Taylor points should plot to the left and the bifurcate/lobed points should plot to the right.  It's notable that four of the five points from the Nipper Creek cache plot close together. Those points were almost certainly produced during a short period of time (but so was 5963 NC 4, so . . . something to think about).
14 Comments
Thomas Schroeder
10/4/2016 10:01:00 am

Thanks for the post, Andy. I know I am not your intended audience but I studied the post (and the anatomy planes) for 45 minutes and can't figure out how you arrived at points s5 and s6. I considered the point to relate to anatomy as follows: The tip is the head, the base is the feet, and when lying on a table, the portion one would see is the front and the side touching the table is the back. In anatomy then, a bisecting coronal plane would slice the portion of the point touching the table in half from the portion we see. The a bisecting sagittal plane would slice the point in half from left to right. Finally, a bisecting axial (or transverse) plane would slice the top of the point from the base. Is that is already wrong then can you correct me?

So then, when you get to the final figure you define s5 and s6. In the picture it appears like the point in being dipped in a pool. My understanding of the planes would say that the pool is the axial plane (maybe that is wrong). But what I can't figure out is what determined how "deep" to "dip" the point into that pool/plane? (I know you did not "dip" the point but still can't figure out how to define s5 and s6).

Thomas


Reply
Thomas Schroeder
10/4/2016 10:23:06 am

So, I think I already figure out that I have my coronal and axial planes reversed from how you defined them. Still working on how you defined s5 and s6.

Reply
Andy White
10/4/2016 10:38:38 am

It's a bit confusing because the planes are named in the software (I have no control over the names) and the only one you can define is the axial plane. The other planes are automatically defined in relation to the axial plane.

Hold your left hand out in front of you, palm facing you, fingers up. Pretend your fingertips are the tip of the point and the heel of your hand is the base. The axial plane would extend out the edges of the point. The sagital plane extends vertically from the middle of the tip to the middle of the heel. The coronal plane would cut through your hand horizontally from the proximal thumb joint to the edge below the pinky.

s5 and s6 are defined by where the coronal plane intersects the lateral edges of the point, midway between s0 and s2 on one side and s1 and s3 on the other.

Reply
Thomas Schroeder
10/4/2016 12:35:11 pm

Got it. Thanks. In my second comment I was finally able to discern the planes properly. Now, I also understand s5 and s6 since you added "midway between s0 and s2 on one side and s1 and s3 on the other."

Next, I'll move on to figure out how those geometry points are used to differentiate and plot Kirk points and then what we can learn from that plotting.

Steve Timmermans
10/4/2016 07:25:20 pm

That's great that you're exploring the morphometric data with PCA, and the most important thing to keep in mind with PCA is that PC1 and PC2 almost always describe Size and Shape, usually in that order. So while PC1 (size) might describe most of the variation in the data, in this case when looking to best describe Kirk point variation, PC2 (shape) is likely the more important ordinal axis to be keeping an eye on and interpreting. This doesn't mean that PC1 (size) doesn't matter, but when looking at stylistic variation, which likely varies temporally, spatially, functionally, and in relation to source material, shape probably is more explanatory than size. And also because we know that certain lithics experienced multiple resharpenings, putting too much explanatory weight on size could be somewhat misleading. I have two main suggestions for what can be done next: 1) PCA is a non-parametric morphometric ordinal descriptor analysis, and it might be a good idea to examine the data parametrically to determine the relative importance of PC1 and PC2 in relation to other data parameters such as lat/long, material type, type of site (if known), etc.; 2) you might also consider Canonical Correspondence Analysis (CCA), which you can include PC1 and PC2, raw data parameters used to produce PC1 and PC1, spatial data, material type, soil sype, elevation, etc.

Reply
Andy White
10/4/2016 07:30:41 pm

Thanks for the comment.

The PCA plot in this case is on 3D data that were analyzed with Procrustes analysis. My understanding is that Procrustes eliminates "size" by scaling everything the same.

Resharpening: all the landmarks are on the haft. I've excluded points with hafts that seem to have been broken and/or reworked.

All the points (except the Nipper Creek ones) are from the same county: space is constant.

All the points (except the Nipper Creek ones) are the same raw material.

All the points (except the Nipper Creek ones) are from surface collections. The only provenience known is Allendale County, South Carolina.

Reply
Steve Timmermans
10/4/2016 07:38:58 pm

Makes sense Andy. You're looking at a sub-sample of what exists out there for Kirk and looking to hold constant (control) particular variables to answer specific questions.

E.P. Grondine
10/5/2016 09:07:22 am

Your 5947 appears to have a serated edge. Do any of the other points in your sample have this?

Reply
Andy White
10/5/2016 10:17:44 am

Serration is common on Kirk and other Early Archaic point types, as well as points from other time periods. It is a functional attribute related to what the tool was designed to do. It has no more to do with diffusion from Europe than the serrations on your steak knife, just FYI.

Reply
E.P. Grondine
10/6/2016 07:22:38 am

Hi Andy -

I am not a lithics expert, but rely upon others for that.

That said, if no other points in your sample have seration, then this item differs significantly from them. As to the number, direction, and sequence of strikes, flint sources, oxidation, resharpening, etc., that is work you have chosen to undertake. Regnier's work with pottery may help you.

Now if you can identify any nearby cultural development leading to Canadian Red Paint Culture, please share and let us all know.

Yes, seration is adopted by both Glacial Kame and Ohio Red Ochre (your 5947 has the same color as Coshocton flint), but given seration's appearance much earlier in Canada, it appears to have diffused from there to other peoples.

Andy White
10/6/2016 12:34:29 pm

Hi E.P.,

You're way off on this one.

Many of the points in the sample (like Kirks from all over the eastern woodlands) are serrated. You can look at the 3D models and see for yourself (look under "Work in Progress --> Kirk Project").

Kirk dates to around 9500 RCYBP (i.e., the Early Archaic). It's considerably earlier than Glacial Kame, which is Late Archaic.

Serration, like bevel resharpening, is almost certainly a primarily functional attribute. Where are you getting your information that it came from Europe (as you said in your video)? That's baloney.

The image of 5947 is a 3D model that shows the surface features, not the raw material characteristics. All the models are gray. As stated in the post, the vast majority of points in the sample (including 5947) are made from Allendale chert (from Allendale County, South Carolina, where the point was found.

E.P. Grondine
10/7/2016 11:58:04 am

Hi Andy -

Glad to hear that 5947 is a model.

I am used to seeing so much really bad work in North American archaeology I thought I was viewing some more of it. My apologies.

"fine" seration, unlike rough seration, is pretty much a confined technology, and is useful in very rough dating.

7,500 BCE (your 9500 RCYBP) is after 8,350 BCE,Canadian Red Paint's appearance date. (I am used to working with absolute calendar dates for astronomical and geological events and for tree ring series.)

I used to have Tony DeRagnacourt to help with lithics, but now that he has passed on, I rely on the finest "lithic artists" in the US.

Glacial Kame is Huron ancestral and spatially well separated from Ohio Red Ochre. For worknotes on Iroquoian survival (C mt DNA) of the Holocene Start Impact Events at Big Bone Lick,see:

http://archaeologica.boardbot.com/viewtopic.php?f=9&t=3656

http://archaeologica.boardbot.com/viewtopic.php?f=9&t=3668


Andy White
10/8/2016 06:40:50 am

E.P.,

I'm not sure that you're in a position to pass judgement on what constitutes"good" and "bad" work in North American archaeology.

Based on what little I have seen, I gather you're drawing some of your ideas about archaeological cultures, tools, and genetics from claims related to the Atlantis, hyperdiffusion, giant literature that's out there. I can tell you that many of the assertions in that literature are completely ridiculous, and you should be wary of accepting what they tell you about North American chronology and stone tools.

This is your statement:

""Fine" seration, unlike rough seration, is pretty much a confined technology, and is useful in very rough dating."

Says who? Fine serration occurs on various Early Archaic points in the Eastern Woodlands (many of those were probably mutli-functional tools used for various cutting, sawing, and piercing tasks), but also occurs on triangular arrow points much later in prehistory. So how is it useful for rough dating? I don't know where you got the idea that serration is a way to track connections between New World and Old World peoples, but it's not.

Can you provide a reference dating the "Red Paint People" to 8350 BC? When I look them up, I see much later dates. The exception is from people who want them to be refuges from Atlantis, and therefore need to have a very early appearance date to be consistent with Plato's description of the island sinking into the sea. Is this where you're coming from?

E.P. Grondine
10/9/2016 07:03:56 am

Hi Andy -

While I know the "alternative" press operations quiet well, and keep trying to explain its birth, growth, and operation to those who have an interest in it, my own readings and studies are pretty much very traditional and span many years.

I have my own scale for measuring archaeologists. You give me a date for a site that is off by 2,000 years, you'e not very good.
You ignore contact era peoples, you're not very good. You ignore the problems of cultural identification with surviving peoples, you're not very good.

If a person puts points from different chert sources with very different manufacture into one data base, then that person would not be very good.

""Fine" seration, unlike rough seration, is pretty much a confined technology, and is useful in very rough dating."

Says who?
I do.

The earliest appearance is Canadian Red Paint and it radiates from there. ( 8350 BCE that was the "official" Canadian date for government purposes.)

It is analogous to Clovis, which is associated with short people, first appears along the Gulf Coast, and radiates from there.

You have your stone artifactsto deaql with, and I have mine:
https://www.youtube.com/watch?v=-D4OK8Vcj7E

I can't help it if your point database software is crappy.

Reply


Leave a Reply.


    All views expressed in my blog posts are my own. The views of those that comment are their own. That's how it works.

    I reserve the right to take down comments that I deem to be defamatory or harassing. 

    Andy White

    Follow me on Twitter: @Andrew_A_White

    Email me: andy.white.zpm@gmail.com

    Enter your email address:

    Delivered by FeedBurner


    Picture

    Sick of the woo?  Want to help keep honest and open dialogue about pseudo-archaeology on the internet? Please consider contributing to Woo War Two.
    Picture

    Follow updates on posts related to giants on the Modern Mythology of Giants page on Facebook.

    Archives

    January 2023
    January 2022
    November 2021
    September 2021
    August 2021
    March 2021
    June 2020
    April 2020
    March 2020
    January 2020
    December 2019
    November 2019
    October 2019
    September 2019
    May 2019
    April 2019
    January 2019
    December 2018
    November 2018
    October 2018
    September 2018
    August 2018
    July 2018
    June 2018
    May 2018
    April 2018
    March 2018
    February 2018
    January 2018
    December 2017
    November 2017
    October 2017
    September 2017
    August 2017
    July 2017
    June 2017
    May 2017
    April 2017
    March 2017
    February 2017
    January 2017
    December 2016
    November 2016
    October 2016
    September 2016
    August 2016
    July 2016
    June 2016
    May 2016
    April 2016
    March 2016
    February 2016
    January 2016
    December 2015
    November 2015
    October 2015
    September 2015
    August 2015
    July 2015
    June 2015
    May 2015
    April 2015
    March 2015
    February 2015
    January 2015
    December 2014
    November 2014
    September 2014
    August 2014
    June 2014
    May 2014
    April 2014
    March 2014

    Categories

    All
    3D Models
    AAA
    Adena
    Afrocentrism
    Agent Based Modeling
    Agent-based Modeling
    Aircraft
    Alabama
    Aliens
    Ancient Artifact Preservation Society
    Androgynous Fish Gods
    ANTH 227
    ANTH 291
    ANTH 322
    Anthropology History
    Anunnaki
    Appalachia
    Archaeology
    Ardipithecus
    Art
    Atlantis
    Australia
    Australopithecines
    Aviation History
    Bigfoot
    Birds
    Boas
    Book Of Mormon
    Broad River Archaeological Field School
    Bronze Age
    Caribou
    Carolina Bays
    Ceramics
    China
    Clovis
    Complexity
    Copper Culture
    Cotton Mather
    COVID-19
    Creationism
    Croatia
    Crow
    Demography
    Denisovans
    Diffusionism
    DINAA
    Dinosaurs
    Dirt Dance Floor
    Double Rows Of Teeth
    Dragonflies
    Early Archaic
    Early Woodland
    Earthworks
    Eastern Woodlands
    Eastern Woodlands Household Archaeology Data Project
    Education
    Egypt
    Europe
    Evolution
    Ewhadp
    Fake Hercules Swords
    Fetal Head Molding
    Field School
    Film
    Florida
    Forbidden Archaeology
    Forbidden History
    Four Field Anthropology
    Four-field Anthropology
    France
    Genetics
    Genus Homo
    Geology
    Geometry
    Geophysics
    Georgia
    Giants
    Giants Of Olden Times
    Gigantism
    Gigantopithecus
    Graham Hancock
    Grand Valley State
    Great Lakes
    Hollow Earth
    Homo Erectus
    Hunter Gatherers
    Hunter-gatherers
    Illinois
    India
    Indiana
    Indonesia
    Iowa
    Iraq
    Israel
    Jim Vieira
    Jobs
    Kensington Rune Stone
    Kentucky
    Kirk Project
    Late Archaic
    Lemuria
    Lithic Raw Materials
    Lithics
    Lizard Man
    Lomekwi
    Lost Continents
    Mack
    Mammoths
    Mastodons
    Maya
    Megafauna
    Megaliths
    Mesolithic
    Michigan
    Middle Archaic
    Middle Pleistocene
    Middle Woodland
    Midwest
    Minnesota
    Mississippi
    Mississippian
    Missouri
    Modeling
    Morphometric
    Mound Builder Myth
    Mu
    Music
    Nazis
    Neandertals
    Near East
    Nephilim
    Nevada
    New Mexico
    Newspapers
    New York
    North Carolina
    Oahspe
    Oak Island
    Obstetrics
    Ohio
    Ohio Valley
    Oldowan
    Olmec
    Open Data
    Paleoindian
    Paleolithic
    Pilumgate
    Pleistocene
    Pliocene
    Pre Clovis
    Pre-Clovis
    Prehistoric Families
    Pseudo Science
    Pseudo-science
    Radiocarbon
    Reality Check
    Rome
    Russia
    SAA
    Sardinia
    SCIAA
    Science
    Scientific Racism
    Sculpture
    SEAC
    Search For The Lost Giants
    Sexual Dimorphism
    Sitchin
    Social Complexity
    Social Networks
    Solutrean Hypothesis
    South Africa
    South America
    South Carolina
    Southeast
    Stone Holes
    Subsistence
    Swordgate
    Teaching
    Technology
    Teeth
    Television
    Tennessee
    Texas
    Topper
    Travel
    Travel Diaries
    Vaccines
    Washington
    Whatzit
    White Supremacists
    Wisconsin
    Woo War Two
    World War I
    World War II
    Writing
    Younger Dryas

    RSS Feed

    Picture
Proudly powered by Weebly