I've spent most of today and yesterday trying to find a workflow path that gets me from the collection of 3D data (which I've been doing for months now) to a set of numbers that I can do meaningful analysis on. This has involved, mostly, a lot of trial and error with various software programs. I think I've finally found a series of reasonable steps that will let me go from the 3D models to characterizations of shape data that I can examine visually and statistically.
This is post is mostly a way to document these steps for my own benefit, so that I can refer back to them in a week or a month when I've forgotten what I just figured out. This may not be the final procedure that I end up using for a large scale analysis. I'm putting this out there in public in case anyone finds it useful. Or in case I get hit by a bus and someone else needs to carry on with this important work.
This is post is mostly a way to document these steps for my own benefit, so that I can refer back to them in a week or a month when I've forgotten what I just figured out. This may not be the final procedure that I end up using for a large scale analysis. I'm putting this out there in public in case anyone finds it useful. Or in case I get hit by a bus and someone else needs to carry on with this important work.
Acquiring 3D Data
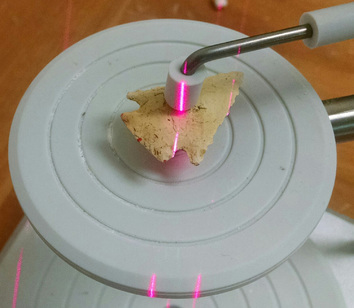 Scan in progress.
I'm using a NextEngine Desktop 3D scanner (UltraHD, Model 2020i). I'm scanning each point in two orientations: (A) one that exposes all the edges and (B) one that exposes the faces. Before scanning, I use a red pen (supplied with the scanner) to place a series of small dots along the edges of the point. These dots are used to align scan sets A and B into a single model (three points are required for alignment), so they should be placed in locations likely to show up in both scans.
I'm using the autodrive (rather than the multidrive) to rotate the points as they are scanned. I use part of an eraser to elevate the point off of the platform, and the padded to gripper to hold it firmly in place without damaging it.
For each scan set, I've got the scanner set to rotate the point through 10 divisions at the middle HD setting (67k points/square inch). This may be overkill, but it's been working so far and I've been producing models far faster than I've been processing them (I've scanned about 90 points but have only processed the models for about 40). I scan with texture capture on, because I need to be able to see the red dots to do the alignment.
Processing 3D Data
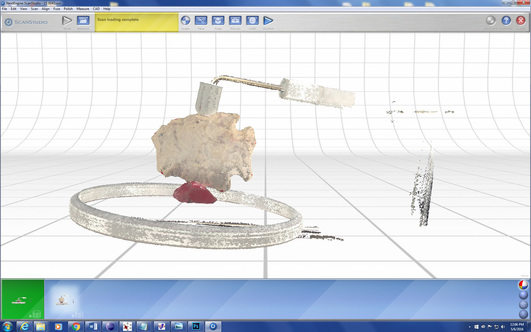 Example of raw scan data.
I keep copies of the raw (unprocessed) scan data in an archive folder. At the settings I'm using, the raw data for a set of scans from a single point occupies about 300-450 MB. I copy the files for each point and put them in a "processing folder."
Processing is done in the ScanStudio software that came with scanner. The first thing I do is trim away the non-point things that were captured in the scan. This is a simple operation: you just select what you don't want and delete it. Because I'm scanning in two different orientations, it doesn't matter if a small bit of the actual point gets deleted where it's touching the eraser and gripper - data for those areas will be contained in the other set of scans.
Processing is done in the ScanStudio software that came with scanner. The first thing I do is trim away the non-point things that were captured in the scan. This is a simple operation: you just select what you don't want and delete it. Because I'm scanning in two different orientations, it doesn't matter if a small bit of the actual point gets deleted where it's touching the eraser and gripper - data for those areas will be contained in the other set of scans.
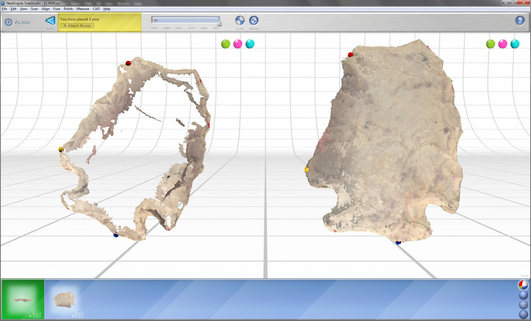 Alignment in process.
After the two sets of scans are trimmed, I align A and B. This is done by determining which of my red dots I can most reliably locate on both scan sets and marking them with color-coded pins. Again, this is a fairly simple process. I've found that some care in this step can significantly reduce the amount of time you have spend cleaning up the model later.
After at least three pins are placed (I'm not sure that placing more than three actually leads to better results), you hit the "align" button and see what you get. I find it helpful to switch the display mode to "solid" at this point (removing the photo-like surface texture) because it is much easier to see how the two scan sets actually lined up. If the alignment is bad, you can tell. Sometimes an alignment issue can be mitigated by just going back and re-setting the pins and doing the alignment again. Other times it is apparent that the best solution is to go back to square one and re-generate the raw scan data (i.e., put the thing on the scanner and start over).
After at least three pins are placed (I'm not sure that placing more than three actually leads to better results), you hit the "align" button and see what you get. I find it helpful to switch the display mode to "solid" at this point (removing the photo-like surface texture) because it is much easier to see how the two scan sets actually lined up. If the alignment is bad, you can tell. Sometimes an alignment issue can be mitigated by just going back and re-setting the pins and doing the alignment again. Other times it is apparent that the best solution is to go back to square one and re-generate the raw scan data (i.e., put the thing on the scanner and start over).
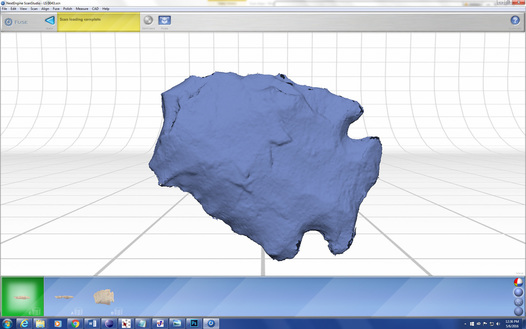 Fused model.
Assuming the alignment is okay, I fuse the two scan sets together with the "fuse" command. This is a one-button operation. This is another one button operation. I'm using these fuse settings:
The fused model requires some clean up. There are often small bits "floating" around the edges and at locations on the surface were data from A and B overlapped. These can be removed using the trim tool. The cleaner the model, the less time this will take, obviously. I really feel like the scanner has good days and bad days: sometimes it seems like the scans are really messy no matter what you do, and sometimes things just work out easily. Regardless, I'm not sweating pixel-level details on these models because it won't affect the kind of morphometric analysis I'm planning on doing. I just need the models to be fairly good approximations of the actual point.
After cleaning up the fused model, I run the "remesh" operation (resolution ratio = 0.9) to fill the holes and even things out a bit. Sometimes this reveals a few more defects that can be addressed through limited trimming. In that case, I'll run the "fill holes" operation ("smooth" and "smooth boundaries" checked) afterward to fill any remaining holes in the mesh.
The file I'm working with to produce these images is about 23 MB at this point. I use the "simplify" tool (set at 0.0050") to reduce the file size to about 5 MB. Then I create a .STL file for exporting the model to Sketchfab and a .PLY file to use for analysis in Landmark. Here is the model on Sketchfab:
- Volume Merge,
- Resolution Ratio 0.5
- "Create Watertight Model" unchecked
- "Include Textures" checked
- Texture Blending 5 pixels
The fused model requires some clean up. There are often small bits "floating" around the edges and at locations on the surface were data from A and B overlapped. These can be removed using the trim tool. The cleaner the model, the less time this will take, obviously. I really feel like the scanner has good days and bad days: sometimes it seems like the scans are really messy no matter what you do, and sometimes things just work out easily. Regardless, I'm not sweating pixel-level details on these models because it won't affect the kind of morphometric analysis I'm planning on doing. I just need the models to be fairly good approximations of the actual point.
After cleaning up the fused model, I run the "remesh" operation (resolution ratio = 0.9) to fill the holes and even things out a bit. Sometimes this reveals a few more defects that can be addressed through limited trimming. In that case, I'll run the "fill holes" operation ("smooth" and "smooth boundaries" checked) afterward to fill any remaining holes in the mesh.
The file I'm working with to produce these images is about 23 MB at this point. I use the "simplify" tool (set at 0.0050") to reduce the file size to about 5 MB. Then I create a .STL file for exporting the model to Sketchfab and a .PLY file to use for analysis in Landmark. Here is the model on Sketchfab:
Deriving 3D Landmark Coordinates
This is the part of the equation I just figured out the other day. I discovered the Landmark software package (available here) that allows you position sets of landmarks on the surfaces of 3D models. The software was designed with three-dimensional, irregular biological structures (such as bones) in mind, but will work great for projectile points as well. It is mainly a software to acquire, rather than analyze, coordinate data (at least in my plan).
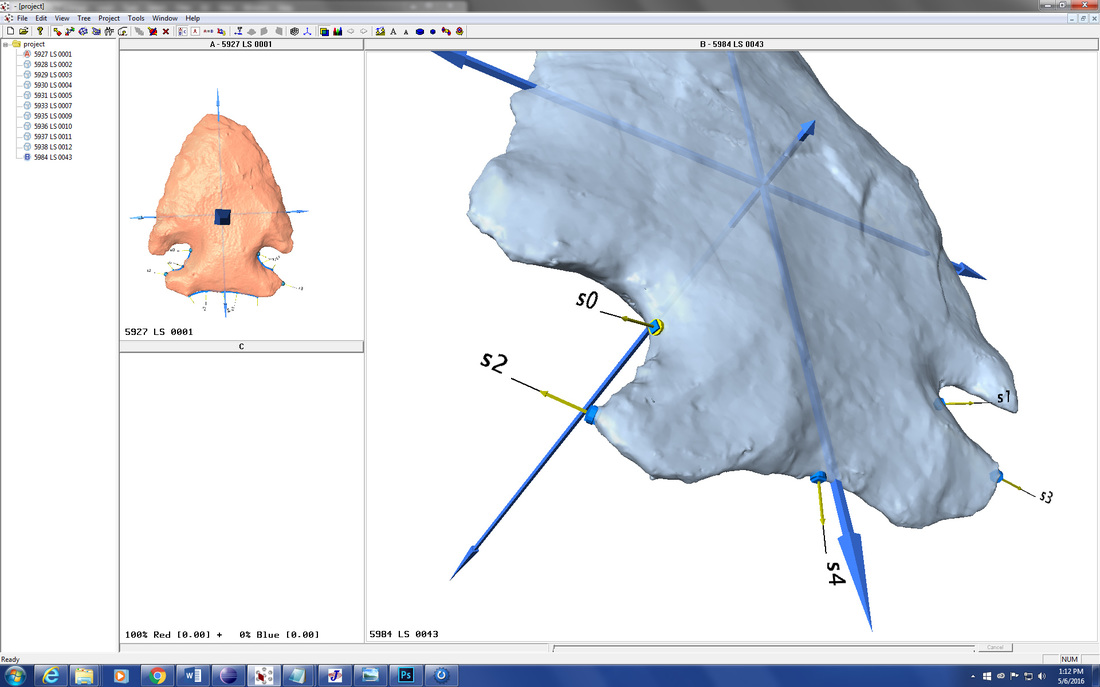
Even though the manual says the software will work with .STL files, it didn't seem to want to do it for me. So I converted a batch of 10 Kirk models into .PLY files so I could import them into Landmark and work my way through the process of generating data. I added the model I just created above to the batch to illustrate the steps in this software.
Even though the manual says the software will work with .STL files, it didn't seem to want to do it for me. So I converted a batch of 10 Kirk models into .PLY files so I could import them into Landmark and work my way through the process of generating data. I added the model I just created above to the batch to illustrate the steps in this software.
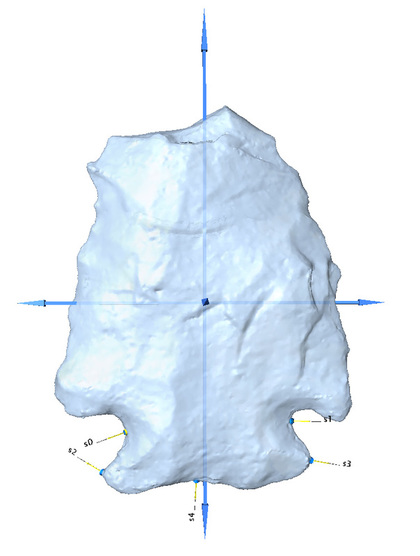
For a trial run, I defined five replicable landmarks that can be placed in the haft region when the point is orientated with the tip pointing up: the points of greatest constriction (s0 and s1), the points of greatest width below the notches (s2 and s3), and the point of greatest divergence from horizontal along the basal edge (s5). The labels are automatically applied to the points as you place them.
As in other software like this, you place the landmarks in the same order each time because the end result is to going to be a file of numbers with XYZ coordinates corresponding to the locations of those landmarks on each of the objects in your assemblage. The next software that reads that file is going to assume that the coordinates are all in the same order, so they better be or you'll get nonsense back. Landmark helps with this by making the process of applying consistent sets of landmarks to different objects semi-automated.
Here is a close up showing the landmarks placed on the surface of the model. You can use your mouse to drag them around and get them exactly where you want them:
After I placed the five landmarks on a group of ten Kirk point models, I exported the coordinates of the landmarks by highlighting all the models (listed in the pane on the left) and using the "export" function (in the Project menu). I had to play around with several different options to get a file that would eventually work in the analysis software I found (see below). Supposedly I should be able to export files in a format that can be read directly by MorphoJ, but I couldn't get it to work. I had to export the data in the .DTA format and then just edit the text file myself to a format that MorphoJ could read. The .DTA format has the advantage of being a single file with all the coordinates clearly organized, so editing it was no big deal.
Analysis of 3D Coordinate Data
Once you have 3D coordinate data, what do you do with them? I was surprised to find that my most beloved data analysis package, JMP, doesn't seem to be able to hand 3D coordinate data. Some of software that can do tricks with 3D data, like EVAN, costs money (which I'd like to avoid spending on a product that I'm not sure is actually going to do what I want it to do). I downloaded various free software packages and played around with several of them. The one I finally got work is called MorphoJ (available here).
The first trick is getting the 3D coordinate data exported from Landmark to be read properly in MorphoJ. As I said above, this wasn't as easy as advertised (here's the relevant section of the MorphoJ manual). Eventually I gave up on the "easy" route and just edited the data from Landmark into a standard comma-delimited text file using Notepad. For future reference, the input data file should look like this:
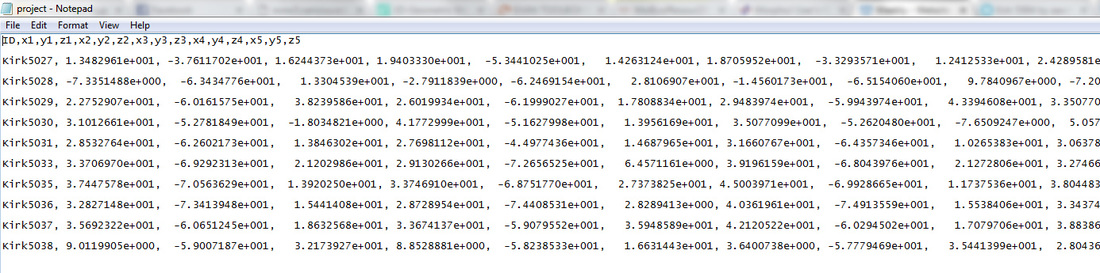
The first line gives MorphoJ the column labels. Each line after that contains data for a single Kirk point: the label of the point, the XYZ coordinates of the first landmark, the XYZ coordinates of the second landmark, etc. Don't put commas at the end of lines, don't put in any tabs, etc.
After you create the data file, you import it into MorphoJ using File-->Create New Project. In the dialog that comes up, click "3 dimensions," select "text" as file type, and then navigate to the text file with the coordinate data. If there are no problems with the import it will tell you so.
Once the data are in there, they'll show up on the Project Tree. Select the data set, go to the Preliminaries menu, and choose "New Procrustes Fit." This performs a Procrustes analysis that rotates, translates, and scales the objects in space to minimize their differences:
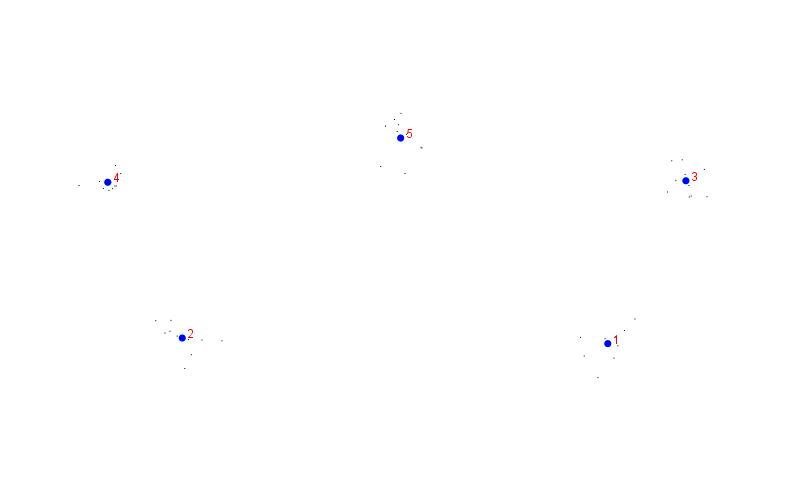
The graphic above shows the results of the Procrustes analysis, with the numbered points representing the centroids and clouds of smaller points around them representing the spread of actual data values. Notice that the points are flipped vertically and horizontally from the way I showed them in the images above, and also that s0 is now "1," s1 is now "2," etc. The results can be viewed along three different axes.
The Procrustes data can be used to do a Principal Components Analysis, which reduces the three axes down to two. Here is what that looks like:
The Procrustes data can be used to do a Principal Components Analysis, which reduces the three axes down to two. Here is what that looks like:
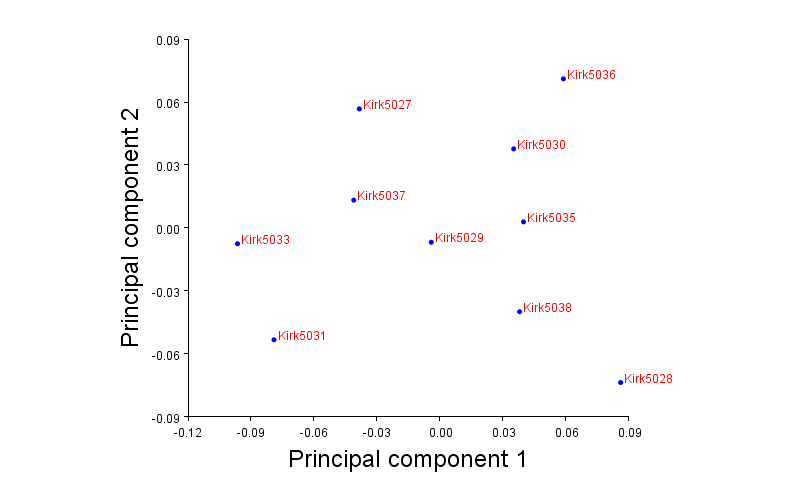
Now we're getting somewhere! The last hurdle will be to figure out if/how I can export the raw principal component data so I can analyze it in another software package.
Working my way through these steps was a "proof of concept" exercise that I needed to do before scaling the analysis up to the full sample. I've been down a lot of dead ends with software. I'm hoping this is the combination that gets me to a full-scale analysis. The five landmarks I used for the test run really don't take advantage of the 3D model data that I have, so I'll need to start thinking in three dimensions rather than two. And I still don't know how to make use of the data from curves. Once I get those things sorted out, it will be really interesting to see how variation patterns out with a much larger sample (I'm aiming for 100) from a single county and a single raw material. Based on what I've seen as I've been creating the 3D models, I will be surprised if some component of temporal variation is not detectable.
And then, of course, I'll need to do about 10,000 more of these to see what's going on in the rest of the country.
 RSS Feed