I submitted the final grades for my class yesterday, so barring some kind of last minute disaster, my first academic year at South Carolina is done. I'm spending the last part of the week working on the radiocarbon compilation (which I'll need for my paper at SEAC in the fall), moving forward with analysis for a couple of publications I'm working on, and prepping to go in the field and then give a talk next week. My blog has been getting a lot of traffic related to the posts I wrote about the ethnographic megalithic societies of India and Indonesia last year (most of them should come up if you search on "megaliths"). I wish I had time to look at that stuff again right now, but I don't.
I wanted to post this histogram showing the distribution of the ~9,100 dates (intercepts) currently in the radiocarbon compilation (here's the map of the dates I made yesterday). There's a pretty clear trend of an increasing number of dates through time. Part of that, I think, almost certainly reflects the emphasis that archaeology in the Eastern Woodlands places on the Woodland and Late Prehistoric/Mississippian societies that largely post-date 2000 RCYBP (and the fact that those societies tend to produce large sites with lots of datable deposits). But I think the chart below, as unrefined as it is, is probably also telling us something very basic about demographic change. There's an inflection point in the number of dates toward the end of the Middle Archaic period (about 5500 RCYBP) that corresponds in time to when we see (generally) more intensively occupied sites, indicators of decreasing mobility, and increasing use of plants that are later domesticates. Yes, I'm saying intensification.
I wanted to post this histogram showing the distribution of the ~9,100 dates (intercepts) currently in the radiocarbon compilation (here's the map of the dates I made yesterday). There's a pretty clear trend of an increasing number of dates through time. Part of that, I think, almost certainly reflects the emphasis that archaeology in the Eastern Woodlands places on the Woodland and Late Prehistoric/Mississippian societies that largely post-date 2000 RCYBP (and the fact that those societies tend to produce large sites with lots of datable deposits). But I think the chart below, as unrefined as it is, is probably also telling us something very basic about demographic change. There's an inflection point in the number of dates toward the end of the Middle Archaic period (about 5500 RCYBP) that corresponds in time to when we see (generally) more intensively occupied sites, indicators of decreasing mobility, and increasing use of plants that are later domesticates. Yes, I'm saying intensification.
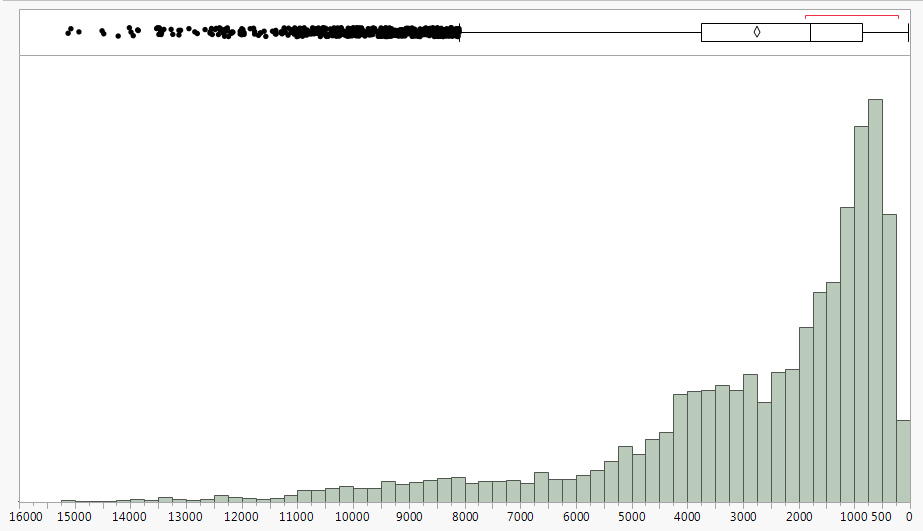
Distribution of the RCYBP intercepts of 9,129 radiocarbon dates from the Eastern Woodlands.
I think I've found a path forward that will let me extract morphometric data from the 3D models of Kirk points that I've been producing (I've got 41 models uploaded to Sketchfab so far, with a goal of 100 from Allendale County, South Carolina, to serve as the basis for a paper). I found a software package called Landmark (available here for free) that was developed at UC Davis for use with biological materials (i.e., irregularly shaped things). It allows you to load in a 3D model, place markers and curves on the surface, and export the coordinates of the points for analysis. I've spent the day learning how to use the software, and have generated a small data set of five points and four curves from ten of my Kirk point models. The next step is to figure out how to go from the XYZ coordinates that the software exports into something that I can meaningfully analyze. I don't think that the data analysis package I use (JMP) will do things like Procrustes analysis and, honestly, I've never attempted to analyze a 3D dataset and will need to do some reading to figure out how to start. If any of my bioanthropology friends have done this sort of thing with morphometric data from skeletal remains and have some advice, I'm listening. Please do not tell me to learn how to use R.
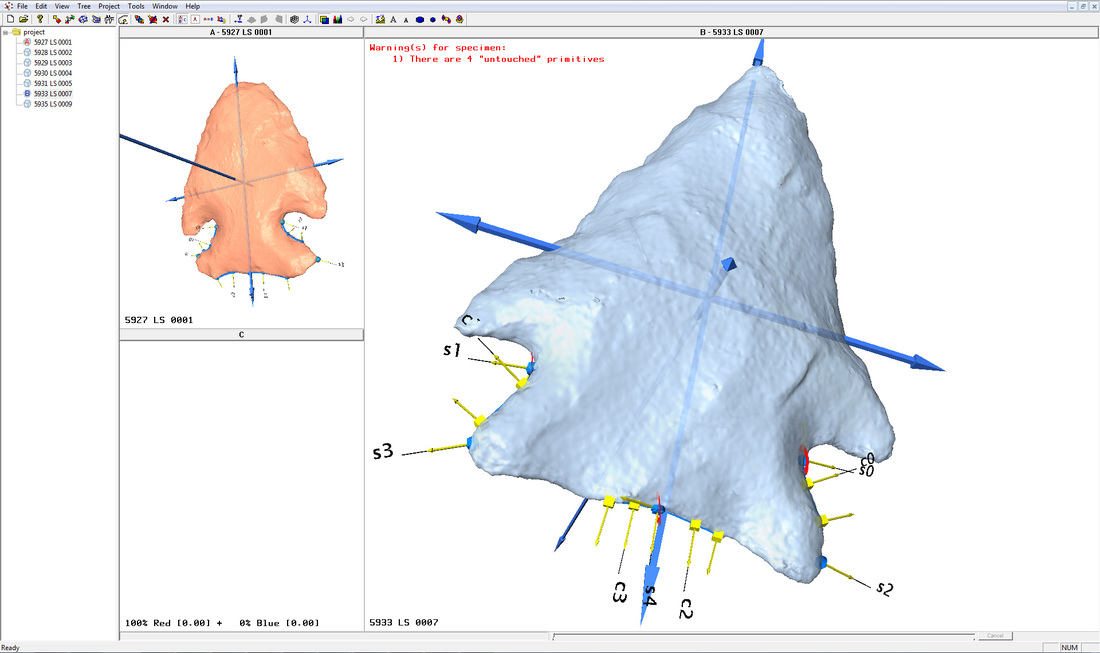
Screenshot of a couple of Kirk models in Landmark. The software lets you define a set of landmarks on one item and then semi-automatically transfer them to another. Then you can export the XYZ coordinates that describe the locations of the points and, somehow, can be used to describe the shapes of curves that are defined.

 RSS Feed