Andy White Anthropology
  • Home
  • Fake Hercules Swords
  • Research Interests
    • Complexity Science
    • Prehistoric Social Networks
    • Eastern Woodlands Prehistory
    • Ancient Giants
  • Blog

Current and Not-So-Current Events: Excavation, Moving, and Other Early Summer Odds and Ends

5/27/2016

 
PictureMy new home.
It's been two weeks since my last blog post.

I've spent much of that two weeks away from my computer, which has been a nice change. Since the semester ended, I've been working in the field, doing stuff around the house and with my family, and prepping my office for a move. Today I'm relocating from the main SCIAA building to a larger, nicer office suite right in the heart of campus. I'll have plenty of room to ramp up my research, process and analyze artifacts, store collections I'm working on, and (hopefully) start getting some student work going. It's really an amazing thing to have the space -- it's larger and nicer than many fully functional archaeology labs where I've worked in the past.

A 6000-Year-Old Moment Frozen in Time?

Archaeological sites are places that contain material traces of human behavior.  While the human behaviors that create archaeological sites are ultimately those of individuals, we usually can't resolve what we're looking at to that level.  Traces of individual behaviors overprint one another and blend into a collective pattern. The granularity of individual behavior is usually lost.

Usually, but not always.

I spent portions of the last couple of works doing some preliminary excavation work at a site I first wrote about last October. Skipping over the details for now, documentation of an exposed profile measuring about 2.2 meters deep and 10 meters long showed the presence of cultural materials and intact features at several different depths.  The portion of the deposits I am most interested in is what appears to be a buried zone of dark sediment, fire-cracked rock, and quartz knapping debris about 1.9 meters below the present ground surface. Based on the general pattern here in the Carolina Piedmont and a couple of projectile points recovered from the slump at the base of the profile, I'm guessing that buried cultural zone dates to the Middle Archaic period (i.e., about 8000-5000 years ago).​
Picture
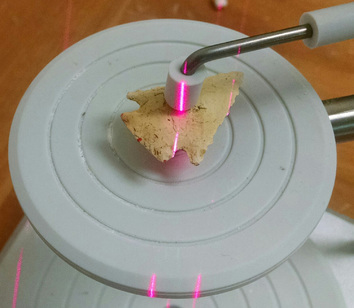
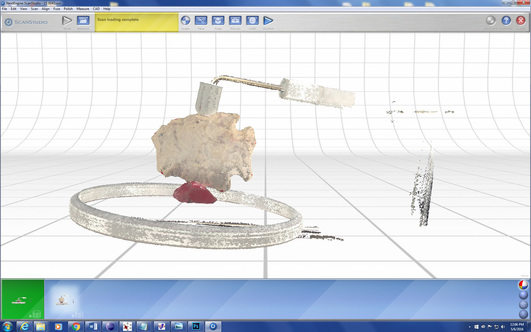
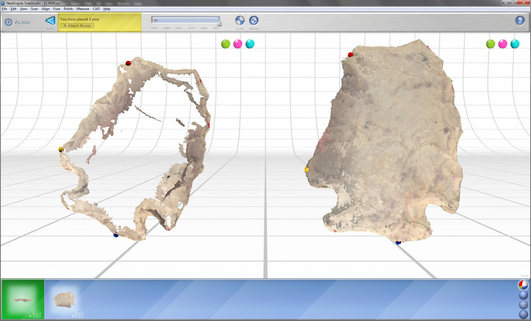
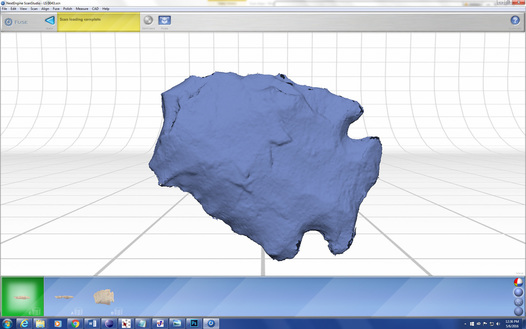
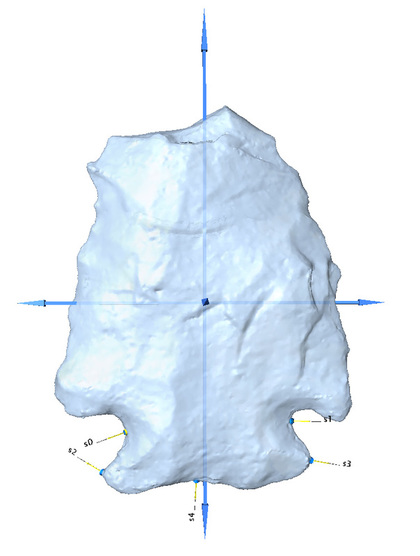
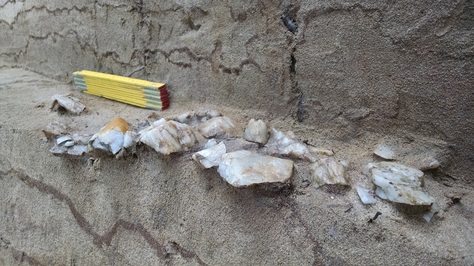
A buried assemblage of quartz chipping debris, probably created by a single individual during a single knapping episode.
I did quite a bit of thinking to come up with my plan to both stabilize/preserve the exposed profile and learn something about the deposits. After I cleaned and documented the machine-cut profile as it existed, I established a coordinate system and began systematically excavating a pair of 1x1 m units that cut into the sloping face of the profile above the deposit of knapping debris visible in the wall. Excavating those partial units allowed me to simultaneously plumb the wall and expose the deposit of knapping debris in plan view. While there is no way to know for sure yet, I think I exposed most of the deposit, which seemed to be a scatter of debris with a concentration of large fragments in a space less than 60 cm across (an unknown amount of the deposit was removed during the original machine excavation, and I recovered numerous pieces of quartz debris from the slump beneath the deposit).  My best guess is that pile of debris probably marks where a single individual sat for a few minutes and worked on creating tools from several locally-available lumps of quartz.  I piece-plotted hundreds of artifacts as I excavated the deposit, so I'll be able to understand more about how it was created when I piece everything back together. 

Picture
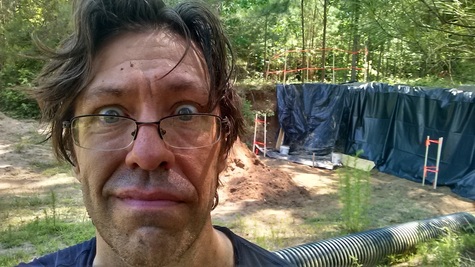
I did what I came to do.
The site I've been working on would be a great one for a field school. It is close to Columbia and has all kinds of interesting archaeology -- great potential for both research and teaching. This May I was out there by myself. It took just about every move of fieldwork jiu jitsu I know (and several that I had to invent on the spot) to do what I did to stabilize the site and get it prepped for a more concerted effort, but I think it's in good shape now. Once I get moved into my new lab space I'll be able to start processing the artifacts and doing a preliminary analysis. I'll keep you posted.​

The Anthropology of Prehistoric Hunter-Gatherers in the Eastern Woodlands?

Earlier in the month, I had the privilege of visiting the archaeological field schools being conducted at Topper. I wrote a little bit about the claim for a very early human presence at Topper here. The excavations associated with that claim aren't currently active. Field schools focused on Late Pleistocene/Early Holocene (Mississippi State University and the University of West Georgia) and Woodland/Mississippian (University of Tennessee) components at Topper and nearby sites have been running since early May. Seeing three concurrent field schools being run with the cooperation of personnel from four universities (and many volunteers) is remarkable.
Picture
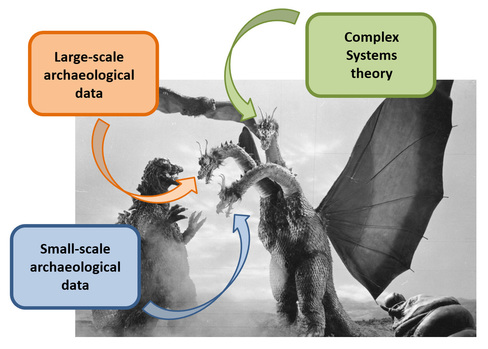
On the day of my visit, I gave a talk titled "The Anthropology of Prehistoric Hunter-Gatherers in the Eastern Woodlands?" I argued that not only is it possible to do the anthropology of prehistoric peoples, but it should be a fundamental goal. Skipping over the details for now, I argued (as I have elsewhere) that complex systems science provides a set of tools for systematically trying to understand how history, process, and environment combine to produce the long-term, large-scale trajectories of prehistoric change that we can observe and analyze using archaeological data. I talked about each of the components of my three-headed monster research agenda.  And I got to eat various venison products prepared under the direction of my SCIAA colleague Al Goodyear. And I got to see alligators swimming in the Savannah River.  As a native Midwesterner . . . I anticipate that working near alligators will remain outside my comfort zone for some time to come.

Picture
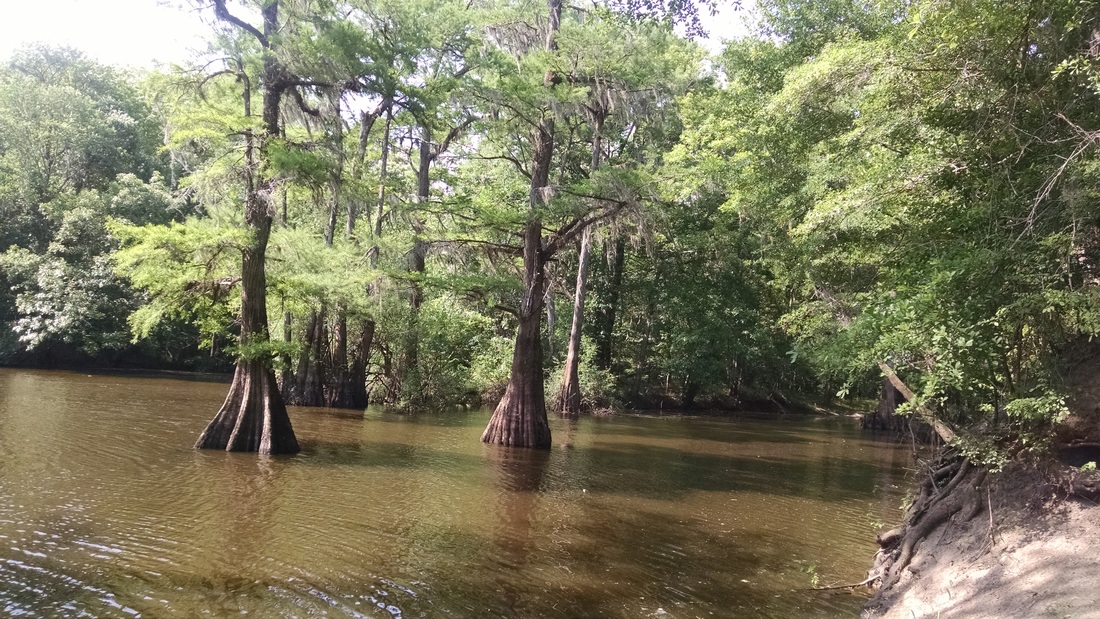
The Savannah River: there are alligators in there.
When Did Humans First Move Out of Africa?

Archaeologists love finding the earliest of anything and people love reading about it. While we often want to know how/when new things appear, identifying the "earliest of X" often gets play in the popular press that is disproportionate to its relevance to a substantive archaeological/anthropological question. And you can never really be sure, of course, that you've nailed down the earliest of anything: someone else could always find something earlier, falsifying whatever model was constructed to account for the existing information and moving the goal posts.

Exactly a year ago, I wrote about the reported discovery of 3.3 million-year-old stone tools from a site in Kenya. Those tools are significantly earlier than the previous "earliest" Oldowan tools.  I think they're really interesting but not particularly surprising:  several other lines of evidence (cut marks on bone, tool-use among chimpanzees, and hominin hand anatomy) already suggested that our ancestors were using tools well before the earliest Oldowan technologies appeared.

I anticipate that we still haven't seen the "earliest" stone tool use. 

A recent report from India argues that our ideas about the "earliest" humans outside of Africa also miss the mark. (Note: when I say "human" I'm referring not to "modern human" but to a member of the genus Homo.) This story from March discusses a report of stone tools and cutmarked bone from India purportedly dating to 2.6 million-years-ago (MYA), blowing away the current earliest accepted evidence of humans outside of Africa (Dmanisi at 1.8 MYA) by about 800,000 years. With an increasing number of Oldowan assemblages dating to about 1.8-1.6 MYA are being reported outside of Africa (e.g., in China and Pakistan), would it be that surprising to find evidence a migration pre-dating 1.8 MYA?  Probably not.  Do the finds reported from India cement the case for human populations in South Asia at 2.6 MYA?  Not yet: the fossils and tools reported from India so far (as far as I know anyway) don't have a context that allows them to be convincingly dated.
My Conversation with Scott Wolter
PictureForbidden Archaeology (ANTH 291-002): It's going to worthwhile.
I had a pleasant conversation with Scott Wolter yesterday. I emailed him to touch base about his participation in my class in the fall, and we ended up talking for about 45 minutes. It was the first time we've spoken and we had more to talk about than we had time to talk. We talked about the Wolter-Pulitzer partnership, of course, but I'm not going ​to go into the details of our discussion (I just invite you to read for yourself Pulitzer's bizarre word salad blog post from Wednesday containing his reference to me as "some back woods rural South Carolina Pseudo-Archaeologist who never worked in the field, but only learned from books").  My sense is that Wolter is someone with whom I can have a frank and vigorous discussion about the merits and interpretation of archaeological evidence and how it is used to evaluate ideas about the past. I'm looking forward to his participation in my class. My plan is to start a Go Fund Me campaign to raise money to fly him down here so he can interact with the students on a face-to-face basis.  

And now the movers are coming for my filing cabinets.  And now my chair is gone.  And now you are up-to-date.

Kirk Project: Workflow from Point to 3D Morphometric Data

5/6/2016

 
I've spent most of today and yesterday trying to find a workflow path that gets me from the collection of 3D data (which I've been doing for months now) to a set of numbers that I can do meaningful analysis on.  This has involved, mostly, a lot of trial and error with various software programs. I think I've finally found a series of reasonable steps that will let me go from the 3D models to characterizations of shape data that I can examine visually and statistically.

This is post is mostly a way to document these steps for my own benefit, so that I can refer back to them in a week or a month when I've forgotten what I just figured out. This may not be the final procedure that I end up using for a large scale analysis. I'm putting this out there in public in case anyone finds it useful. Or in case I get hit by a bus and someone else needs to carry on with this important work.
Acquiring 3D Data
PictureScan in progress.
I'm using a NextEngine Desktop 3D scanner (UltraHD, Model 2020i). I'm scanning each point in two orientations: (A) one that exposes all the edges and (B) one that exposes the faces. Before scanning, I use a red pen (supplied with the scanner) to place a series of small dots along the edges of the point. These dots are used to align scan sets A and B into a single model (three points are required for alignment), so they should be placed in locations likely to show up in both scans.

I'm using the autodrive (rather than the multidrive) to rotate the points as they are scanned. I use part of an eraser to elevate the point off of the platform, and the padded to gripper to hold it firmly in place without damaging it.

For each scan set, I've got the scanner set to rotate the point through 10 divisions at the middle HD setting (67k points/square inch).  This may be overkill, but it's been working so far and I've been producing models far faster than I've been processing them (I've scanned about 90 points but have only processed the models for about 40). I scan with texture capture on, because I need to be able to see the red dots to do the alignment.

Processing 3D Data
PictureExample of raw scan data.
I keep copies of the raw (unprocessed) scan data in an archive folder. At the settings I'm using, the raw data for a set of scans from a single point occupies about 300-450 MB. I copy the files for each point and put them in a "processing folder."

​Processing is done in the ScanStudio software that came with scanner. The first thing I do is trim away the non-point things that were captured in the scan. This is a simple operation: you just select what you don't want and delete it. Because I'm scanning in two different orientations, it doesn't matter if a small bit of the actual point gets deleted where it's touching the eraser and gripper - data for those areas will be contained in the other set of scans.

PictureAlignment in process.
After the two sets of scans are trimmed, I align A and B. This is done by determining which of my red dots I can most reliably locate on both scan sets and marking them with color-coded pins. Again, this is a fairly simple process. I've found that some care in this step can significantly reduce the amount of time you have spend cleaning up the model later. 

After at least three pins are placed (I'm not sure that placing more than three actually leads to better results), you hit the "align" button and see what you get. I find it helpful to switch the display mode to "solid" at this point (removing the photo-like surface texture) because it is much easier to see how the two scan sets actually lined up. If the alignment is bad, you can tell. Sometimes an alignment issue can be mitigated by just going back and re-setting the pins and doing the alignment again. Other times it is apparent that the best solution is to go back to square one and re-generate the raw scan data (i.e., put the thing on the scanner and start over).

PictureFused model.
Assuming the alignment is okay, I fuse the two scan sets together with the "fuse" command. This is a one-button operation.  This is another one button operation. I'm using these fuse settings:
  • Volume Merge,
  • Resolution Ratio 0.5 
  • "Create Watertight Model" unchecked
  • "Include Textures" checked
  • Texture Blending 5 pixels
Fusing scan sets A and B produces a new mesh, conveniently labeled "C." If I'm satisfied with the way C looks, I go ahead and delete A and B at this point.

The fused model requires some clean up. There are often small bits "floating" around the edges and at locations on the surface were data from A and B overlapped. These can be removed using the trim tool. The cleaner the model, the less time this will take, obviously. I really feel like the scanner has good days and bad days: sometimes it seems like the scans are really messy no matter what you do, and sometimes things just work out easily. Regardless, I'm not sweating pixel-level details on these models because it won't affect the kind of morphometric analysis I'm planning on doing. I just need the models to be fairly good approximations of the actual point.

After cleaning up the fused model, I run the "remesh" operation (resolution ratio = 0.9) to fill the holes and even things out a bit. Sometimes this reveals a few more defects that can be addressed through limited trimming. In that case, I'll run the "fill holes" operation ("smooth" and "smooth boundaries" checked) afterward to fill any remaining holes in the mesh.

The file I'm working with to produce these images is about 23 MB at this point. I use the "simplify" tool (set at 0.0050") to reduce the file size to about 5 MB. Then I create a .STL file for exporting the model to Sketchfab and a .PLY file to use for analysis in Landmark.  Here is the model on Sketchfab:

Kirk 5984 by aawhite on Sketchfab

Deriving 3D Landmark Coordinates
This is the part of the equation I just figured out the other day. I discovered the Landmark software package (available here) that allows you position sets of landmarks on the surfaces of 3D models. The software was designed with three-dimensional, irregular biological structures (such as bones) in mind, but will work great for projectile points as well. It is mainly a software to acquire, rather than analyze, coordinate data (at least in my plan). 

Even though the manual says the software will work with .STL files, it didn't seem to want to do it for me. So I converted a batch of 10 Kirk models into .PLY files so I could import them into Landmark and work my way through the process of generating data. I added the model I just created above to the batch to illustrate the steps in this software.
Picture
For a trial run, I defined five replicable landmarks that can be placed in the haft region when the point is orientated with the tip pointing up: the points of greatest constriction (s0 and s1), the points of greatest width below the notches (s2 and s3), and the point of greatest divergence from horizontal along the basal edge (s5). The labels are automatically applied to the points as you place them.

As in other software like this, you place the landmarks in the same order each time because the end result is to going to be a file of numbers with XYZ coordinates corresponding to the locations of those landmarks on each of the objects in your assemblage. The next software that reads that file is going to assume that the coordinates are all in the same order, so they better be or you'll get nonsense back. Landmark helps with this by making the process of applying consistent sets of landmarks to different objects semi-automated.

Here is a close up showing the landmarks placed on the surface of the model. You can use your mouse to drag them around and get them exactly where you want them:


Picture
After I placed the five landmarks on a group of ten Kirk point models, I exported the coordinates of the landmarks by highlighting all the models (listed in the pane on the left) and using the "export" function (in the Project menu). I had to play around with several different options to get a file that would eventually work in the analysis software I found (see below). Supposedly I should be able to export files in a format that can be read directly by MorphoJ, but I couldn't get it to work. I had to export the data in the .DTA format and then just edit the text file myself to a format that MorphoJ could read. The .DTA format has the advantage of being a single file with all the coordinates clearly organized, so editing it was no big deal.

Analysis of 3D Coordinate Data 

Once you have 3D coordinate data, what do you do with them? I was surprised to find that my most beloved data analysis package, JMP, doesn't seem to be able to hand 3D coordinate data. Some of software that can do tricks with 3D data, like EVAN, costs money (which I'd like to avoid spending on a product that I'm not sure is actually going to do what I want it to do).  I downloaded various free software packages and played around with several of them. The one I finally got work is called MorphoJ (available here).

The first trick is getting the 3D coordinate data exported from Landmark to be read properly in MorphoJ. As I said above, this wasn't as easy as advertised (here's the relevant section of the MorphoJ manual). Eventually I gave up on the "easy" route and just edited the data from Landmark into a standard comma-delimited text file using Notepad. For future reference, the input data file should look like this:
Picture
The first line gives MorphoJ the column labels. Each line after that contains data for a single Kirk point: the label of the point, the XYZ coordinates of the first landmark, the XYZ coordinates of the second landmark, etc. Don't put commas at the end of lines, don't put in any tabs, etc.

After you create the data file, you import it into MorphoJ using File-->Create New Project. In the dialog that comes up, click "3 dimensions," select "text" as file type, and then navigate to the text file with the coordinate data. If there are no problems with the import it will tell you so. 

Once the data are in there, they'll show up on the Project Tree. Select the data set, go to the Preliminaries menu, and choose "New Procrustes Fit." This performs a Procrustes analysis that rotates, translates, and scales the objects in space to minimize their differences:
Picture
The graphic above shows the results of the Procrustes analysis, with the numbered points representing the centroids and clouds of smaller points around them representing the spread of actual data values. Notice that the points are flipped vertically and horizontally from the way I showed them in the images above, and also that s0 is now "1," s1 is now "2," etc. The results can be viewed along three different axes.

The Procrustes data can be used to do a Principal Components Analysis, which reduces the three axes down to two.  Here is what that looks like:
Picture
Now we're getting somewhere!  The last hurdle will be to figure out if/how I can export the raw principal component data so I can analyze it in another software package.

Working my way through these steps was a "proof of concept" exercise that I needed to do before scaling the analysis up to the full sample. I've been down a lot of dead ends with software.  I'm hoping this is the combination that gets me to a full-scale analysis. The five landmarks I used for the test run really don't take advantage of the 3D model data that I have, so I'll need to start thinking in three dimensions rather than two. And I still don't know how to make use of the data from curves. Once I get those things sorted out, it will be really interesting to see how variation patterns out with a much larger sample (I'm aiming for 100) from a single county and a single raw material. Based on what I've seen as I've been creating the 3D models, I will be surprised if some component of temporal variation is not detectable.  

And then, of course, I'll need to do about 10,000 more of these to see what's going on in the rest of the country.

Spatial Distribution of the First 4,800 Eastern Woodlands Radiocarbon Dates

4/13/2016

 
I've been working on compiling a database of radiocarbon dates from the Eastern Woodlands. While my interest in doing this is mainly driven by my own research goals (the driving force right now is my desire to be able to discuss the possible abandonment of portions of the Southeast at the end of the Early Archaic period in a symposium I'm pulling together for the 2016 SEAC meetings this fall), I know these data will be useful to others as well.

Here is a GIS map showing the counts by county of the first 4,870 dates that I've gotten plugged in:
Picture
I started with a spreadsheet sent to me by Shane Miller and combined it with data available online from PIDBA (both of those sources were focused on dates from early sites across the east), the Louisiana Division of Archaeology, the Virginia Department of Historic Resources, the Kentucky, Ohio and West Virginia Radiocarbon Database (Cultural Resource Analysts, Inc.), a list of Tennessee radiocarbon dates (Tennessee Archaeology Network), and A Comprehensive Radiocarbon Date Database from Archaeological Contexts on the Coastal Plain of Georgia by John A. Turck, and Victor Thompson. After combining these datasets into a single database (which took some effort), I did a sweep to eliminate redundancies and flag obvious errors. I added a column for county and linked that to a separate table of county names attached to UTM coordinates of the approximate center of the county. That lets me query the database to spit out a table containing a listing of dates and associated UTMs.  I imported that into GIS and then did a "join" to count the number of points per county. Voila.

There are still numerous errors and omissions in the database as it currently stands, which is why I'm not prepared to supply the raw data at this point. I've got many dates that are missing key pieces of information (error, site number, county, etc.), and the columns for references are a total mess at this point.  As I work through the process of cleaning all that up and trying to fill in blanks, I'll be adding new data. I know of some print publications that will help me fill in some of the large blank areas, and I suspect there are other online or electronic sources of data out there.  I've got the UTM coordinates for the counties in most of the Midwest and Southeast (I still haven't done Mississippi and Florida), but I haven't yet started on the tier of states immediately west of the Mississippi River (Arkansas, Missouri, Iowa, and Minnesota) or the Northeast and New England.

A Few Thoughts from the SAA Meetings (Orlando, 2016)

4/9/2016

 
PictureMiG-17. I shall return.
The annual meeting of the Society for American Archaeology (SAA) is going on right now in Orlando. I made the 6.5 hour drive down from Columbia, SC, on Thursday. It took me closer to 8.5 hours, though, because I called an audible and went to visit the birth town of Barnwell, SC, after hearing a story on NPR about James Brown as I was starting my trip. And then I stopped to look at a MiG-17 in the parking lot of the Mighty Eighth Air Force museum in Savannah, GA. It was the B-47 Stratojet visible from I-95 that caught my attention. I didn't actually go in the museum, but you understand why it sometimes takes me a while to get from Point A to Point B when I travel alone.

I'm guessing that most people that read my blog are not professional archaeologists and have never been the SAA's.  These are the annual meetings of the largest professional archaeological organization in the country.  I don't have any numbers on annual attendance, but for archaeologists these meetings are a chance to meet new people, learn new things, talk about ideas and data, and re-connect with others in our social networks.  The array of presentations and posters that one can go to over the course of several days is large (here's the program for this year's meeting). So you have to make choices about how you're going to spend your time.  I just wanted to pass on a few interesting things that I've seen, heard, or thought about over the last couple of days.

An Early Holocene Shaman Burial from Texas

Margaret (Pegi) Jodry gave a really interesting presentation on an 11,100-year-old (ca. 9,100 BC) double burial (a male and a female) from Horn Shelter No. 2 in Texas (you can find the 2014 paper that discusses the burial here). Human remains from the Late Pleistocene/Early Holocene are extremely rare in North America.  The male burial is particularly interesting because it appears, based mostly on the analysis of the contents of the grave, to be the internment of a shaman. The burial includes tools probably used for making pigment (antler pestles and turtle shell bowls), a tool for applying pigment to the skin, and a scarification tool. The burial also included animal remains that probably had symbolic significance: hawk claws and badger claws were found in the vicinity of the head and neck, presumably placed there as part of the burial ceremony. Jodry speculated that the hawk and badger may have symbolized travel to the "upper world" (sky) and "lower world" (underground), respectively.

I found Jodry's discussion of this burial to be really interesting after recently hearing my SCIAA colleague Adam King talk about Mississippian (ca. AD 1000) iconography and cosmology. I wondered how far back in time we might be able to trace the basic cosmological elements that we can discern (with the help of linguistic data) as important to the Mississippian world.  The Hon Shelter burial seems to provide a tantalizing glimpse of the symbolic representation of a tripartite "above" "earth" and "below" cosmos in the Early Holocene, associated with a a projectile point technology (San Patrice) that is related to the Dalton points that are the most common markers of the Late Paleoindian period in the Southeast. Very interesting.
The Indiana "Mummy:" Still Not a Mummy
Picture
If you remember last summer's flap over the supposed "mummy" discovered in Lake County, Indiana, (I wrote about it here) you will be interested to hear that I ran into the archaeologists who were working at the site when the human remains were found. ​As I suspected (which I can't remember if I ever wrote about), the site was one that I had actually worked on in the past: I participated in the Phase II testing of the and others back in the winter of 2004 (you can see a copy of the report by Sarah Surface-Evans and others here). Anyway, James Greene, an archaeologist with Cardno Envionmental Consultation Company, told me that what they encountered was a flexed human burial dating to the Woodland period. The remains were left in place and reburied in consultation with Native American groups. As reported in this story from July 2, the sheriff erroneously described the remains to the press as "mummified." They were not. There was no mummy, and there was no cover-up about a mummy.

Icebergs on the Carolina Coast?
Picture
I've seen a lot of papers over the last couple of days about climatic/environmental change in the Late Pleistocene and Early Holocene. The amount of information that we have now is amazing, and the datasets relevant to understanding recent environmental change continue to diversity and develop (pollen, beetles, ice cores . . .). At a paper by James Dunbar (unfortunately he wasn't there to actually give it, so I didn't get to talk to him about it), I learned about something called the "Georgetown Hole."  This is a spot along the submerged continental shelf off the coast of South Carolina that apparently preserves evidence of icebergs running aground (you can read about it on this page, which is also where I got the image and the quote below). The "scour" marks going from the Georgetown Hole toward the coast were reportedly created by the bottoms of icebergs scraping the continental shelf:

"The location and orientation of the keel marks suggests icebergs were entrained a southwestward flowing coastal current, most likely during the last glaciation. This may be the first evidence of iceberg transport to subtropical latitudes in the north Atlantic."

Apparently these marks were just discovered in 2006/2007.  If I understood Dunbar's paper correctly, there is still no firm answer on exactly when these marks were created. I think (and I'm really not sure, because I was still trying to wrap my head around the image of icebergs drifting by Charleston) Dunbar was suggested this may have been occurring rather late in the Pleistocene, perhaps even associated with the Younger Dryas (about 12,900 to 11,700 years ago) and the environmental changes associated with it. 

Disney World Not Such a Magical Place for a Conference

I'm not sure what the decision-making process was for choosing a Disney resort as a conference location.  Although I'm only offering my own opinion here, I can tell you that many people here agree with me. It's too expensive. I paid $16 for a pre-made chicken sandwich and a coke for lunch today. A pint of beer at the hotel bar is like $8 or so. The hotel rooms are over $200/night. It's impossible to go elsewhere to eat lunch, because we're on a Disney campus. Everything is Disney and everything is expensive unless you want to get in your car and drive somewhere for lunch, in which case you won't make it back in time to make the beginnings of paper sessions in the afternoon. You could argue that this is a "family friendly" location for a conference, but the SAA elected not to provide any childcare services this year. Maybe this is a great place to vacation, but my opinion is that it is a poor choice for a working conference where many of the attendees are here with limited funding and/or on their own dime.
To Be Continued . . .

I'm going to cut if off for now and get back to the business of the conference. I saw a good session this morning that was organized by Erick Robinson, Joe Gingerich, and Shane Miller ("Human Adaptations to Lateglacial and Early Holocene Climate and Environmental Changes"), but I'm hoping to talk to some of the participants more later.  It was good stuff.

One Procedure for Generating Linear Measurements from 3D Models

4/6/2016

 
Things are busy as usual around here, so I don't have time to write much myself today. I wanted to make available to you, however, a nice document produced by Ken Lentz.  Lentz took it upon himself to explore how to go from the 3D models that I'm producing for the Kirk Project to a set of linear measurements. As I wrote recently, getting those linear measurements is something I'm going to need to start doing again in short order. I used a freeware landmark-based program (tpsDIG, which I see is still available here) to derive linear measurements from images for my disseration. The program worked fine, but it was a bit labor intensive and I'm hoping to find an alternate path to getting the same measurements that takes advantage of the fact that I've got a detailed, scaled 3D model sitting right there in front of me. 

Lentz succeeded in getting linear measurements (including angles, which I would really like to be able to measure) from a CAD program, but he had to go through a lot of time-consuming steps to do it.  I'm grateful for his efforts, as I have had zero time myself to seriously explore the issues involved in going from 3D back to 2D. Thanks, Ken, for all your work on this (and taking the time to explain what you did).
Picture

SEAC 2016 Symposium: Hunter-Gatherer Societies of the Early Holocene Southeast

4/4/2016

 
PictureI Googled "hunter-gatherer Athens Georgia" and I found this picture of the drummer of a band called "Hunter Gatherer" playing in Athens, GA. That's good enough for a blog post about a symposium abstract.
The annual meeting of the Society for American Archaeology (SAA) is in Orlando, Florida, this week, running from Wednesday through Sunday. I'm not giving a paper this time around (though I did just sign up to do a 3 minute lighting talk in the Digital Data Interest Group), but I'm looking forward to driving down and hearing about what others have been up to lately.

I'm also going to be asking around (and maybe, although I've never been very good at it, attempting to twist a few arms) to try to lock in some participants for a symposium I'm working on for the 2016 Southeastern Archaeology Conference (SEAC) meeting that will be held in Athens, Georgia, in October.  Here is the draft of an abstract I wrote this morning:

Hunter-Gatherer Societies of the Early Holocene Southeast
Societies are groups of people defined by persistent social interaction.  While the characteristics of the early Holocene (> 5000 RCYBP) hunter-gatherer societies of the American Southeast undoubtedly varied across time and space, archaeological data generally suggest that they were often geographically extensive.  Patterns of artifact variability and transport, for example, demonstrate that small-scale elements (e.g., individuals, families, and foraging groups) of these Early and Middle Archaic societies were situated within much larger social fabrics. The goal of this session is to explore the size, structure, and characteristics of these early Holocene hunter-gatherer societies, asking how patterns of face-to-face interactions at human scales “map up” to and are affected by larger social spheres. Theoretical and methodological diversity are welcome, as is an interest in integrating various scales of archaeological data analysis.  
​

I'm hoping this will appeal to a range of scholars, especially those who like to work on multiple scales and address difficult questions.  Ideally, we can get a group of papers together that will be suitable for an edited volume. The first job, however, is seeing what kind of interest there is and who I can get commitments from.  Everything will have to be decided and submitted by the end of August. If you read this and you're interested, please let me know:  [email protected].   

I've got several ideas for what I'll contribute to the session. Something related to Kirk is an obvious one, but I've also been spending more time thinking about the Early/Middle Archaic transition after reading Ken Sassaman's book.  I'm wondering if we can: (1) use multiple lines of evidence to identify an abandonment of the Southeast during the late Early Archaic; (2) generate some explanations for that abandonment; (3) understand how social structure would have affected (and been affected by) whatever the causes of an abandonment were and whatever processes were in operation.  And I'm also in the last stages of writing a new agent-based model that I'm going to use to try to attack the equifinality problem that hampers our ability to differentiate among group mobility, personal mobility, and exchange as mechanisms for the very-long-distance transport of stone artifacts.

Eastern Woodlands Radiocarbon Compilation

3/27/2016

 
Picture
I've started a new page to store links to online sources of radiocarbon data and references for published compilations. As I discussed briefly in this blog post, I'm interested in a assembling a pan-Eastern Woodlands radiocarbon dataset that can be used to evaluate the idea that there was an abandonment of the Southeast at the end of the Early Archaic period.

The page has links to several datasets (such as CARD and the files posted at PIDBA) that include dates from across the Eastern Woodlands. I've also started a section listing sources by state, which is the scale at which many compilations are created. Thanks to Stuart Fiedel for pointing me in the direction of several compilations from the Atlantic coast. I stumbled across data from the Georgia Coastal Plain, a Tennessee dataset, and a Louisiana database and have provided links to those.  

Conspicuously absent so far are compiled datasets from South Carolina, Alabama, Mississippi, Illinois, Indiana, and Pennsylvania. Presuming that a South Carolina dataset does not already exist, it seems that the responsibility for assembling one would logically be mine. I'm hoping some of you out there can let me know about datasets that will help fill in the gaps and perhaps update some of the older compilations.


At some point, I'll combine all the existing data together and make it all available. It shouldn't be that tough but it will take a little time. It will be a matter of creating a database with the necessary fields and then adding existing data either electronically (i.e., in cases where data are already available electronically) or manually.  The less manual data entry, the better.

​Please leave a comment here if you know of sources that I haven't yet included.

The Kirk Project: An Update

3/17/2016

 
Picture
I had some time today to upload some current Kirk Project files and do a little re-organization of the pages.  The main page is still located here, but I've split off some of the content that used to be on that page and created separate pages for datasets, a list of 3D models organized by state (so far they're all from South Carolina), embedded links to 3D models organized by ID number, and 2D images. There is nothing on the 2D image page yet, but my plan is to start adding images as I have time.

I've been steadily accumulating 3D models (there are 22 now that I've uploaded to Sketchfab). I still haven't started wrestling with them to extract usable morphometric data, but I've got a plan for a paper that will compare variability in the large, surface collected sample from Allendale County (South Carolina) to the variability present in smaller assemblages from excavated contexts (and shorter windows of time). One of those assemblages will be the Nipper Creek cache. Another (hopefully) will be the Kirk material from G. S. Lewis-East.  Hopefully I'll be able to get one or two more "narrow time window" assemblages.

Picture
In terms of data, I've produced an updated GIS map of the current sample (n=905). It now includes several points from Pennsylvania (donated by Bill Wagner). I've also provided a file of the metric data that I have for 699 of those points. As explained on the data page, the sample of points for which metric data are available is smaller than the larger Kirk sample because I did not measure all of the points during my dissertation work (some were too fragmentary) and I have not started generating linear measurements of the points I'm adding now.  

The linear measurements have alphabetic designations (A through I, as defined in this figure). I calculated them by digitizing landmarks using a freeware package, and it was kind of a pain in the butt.  I'm hoping to find a better software package than I used before, and I plan on adding some additional 2D dimensions/angles since I won't also be dealing with lanceolate points.

I did not produce 3D models of any of the points in my dissertation dataset, as I did not have access to the equipment to do that at the time. ​

I plan on adding a "Contributors" page soon. And I hope to start incorporating more data from external sources in the dataset. I've got lines on some data from Ohio, Tennessee, and a few other areas. I would love to start filling in Florida, Georgia, and North Carolina.

Early Archaic Abandonment of the Southeast: In Search of Compiled Radiocarbon Data

3/13/2016

 
As I mentioned briefly in a post yesterday, I've become interested in looking into the evidence for an abandonment of large portions of the Southeast at the end of the Early Archaic period.  

This (2012) paper by Michael Faught and James Waggoner provides an example of how this could be done on a state-by-state basis.  Faught and Waggoner use multiple lines of evidence to evaluate the idea of a population discontinuity between the Early Archaic and Middle Archaic periods in Florida. One of the things they discuss is the presence of a radiocarbon data gap between about 9000 and 8000 radiocarbon years before present (RCYBP). They are able to identify that gap (which is consistent with a significant drop in or lack of population at the end of the Early Archaic using a dataset of 221 pre-5000 RCYBP radiocarbon dates from Florida. 
PictureGeographical distribution of LeCroy cluster points (roughly following Justice 1987).
Assembly of radiocarbon datasets for states across the Eastern Woodlands would be really useful for seeing if there is a similar "gap" in other areas of the Southeast that correlates with technological and statigraphic discontinuities. It seems to me that small bifurcate points (e.g., LeCroy cluster) and/or larger lobed points (e.g., Rice Lobed cluster) are good candidates for marking a contraction or retreat of late Early Archaic hunter-gatherer populations.  While common in the Midwest, such points are absent (?) from Florida and present in only parts of South Carolina, Georgia, Alabama. 

I'm aware of the Kentucky, Ohio, West Virginia Radiocarbon Database published by Cultural Resource Analysts, Inc. I'm wondering if there are similar existing compilations (either print or electronic) for other eastern states, especially those south of the Ohio River. I've only spent a short amount of looking, but I haven't come across any yet. At the risk of being accused of being lazy, I thought I'd throw the question out there and see what turns up. I will be very surprised if radiocarbon compilations haven't been produced for many areas of the east, and it seems worthwhile to ask about existing resources (which may not yet be easily "discoverable" online) before I contemplate yet another large-scale data mining effort.  Please let me know if you can help.


Update (3/27/2016): I've created this "Eastern Woodlands Radiocarbon Compilation" page to store links and references to radiocarbon compilations.

Spring Break Summary

3/12/2016

 
I'm going to skip the usual discussion of how I wish I had more time to write, and go straight to the summary of things I would've written about if I had more time. I'm limiting myself to one paragraph per topic.
PictureCan the distributions of small bifurcate points like this one be used to follow a northward retreat of hunter-gatherer populations at the end of the Early Archaic?
Abandonment of the Southeast During the Early Archaic

I finally finished reading Ken Sassaman's (2010) The Eastern Archaic, Historicized (previous posts here and here). I had a nice email exchange with Sassaman.  Reading his book has gotten me thinking about some new questions to ask of the Archaic record in the Eastern Woodlands.  The suggestion that a large part of the Southeast (south of the Ohio River) was abandoned or very thinly populated/used during the later part of the Early Archaic, connected to the scenario of a population influx during the Middle Archaic, is something that can be evaluated empirically by (I think) assembling data that we've already got on hand. The northward retreat of Early Archaic populations that seems to be marked by the distribution of bifurcate points in South Carolina (see David Anderson's 1991 paper referenced in this post) prompted me to look into Early Archaic point chronology in Florida. Sassaman directed me to this very nice (2012) paper by Michael Faught and James Waggoner.  Faught and Waggoner's discussion of multiple lines of data (radiocarbon, typological, and statigraphic sequences) relevant to evaluating the idea of Early/Middle Archaic population discontinuities in Florida could be used as a blueprint for state-by-state studies across the east.

Picture
Eight Wheels of Death: Totally Worth Seven Dollars

This post marks two firsts: my first mention of roller derby and my first movie review. The short film Eight Wheels of Death is a homegrown effort associated with the Bleeding Heartland Roller Derby in Bloomington, Indiana. I picked up a copy when I went to see my daughter skate last weekend (she's in the junior league Bloomington ThunderBirds). The movie is about what you'd expect, and that's going to be the extent of my review (here's the trailer).It was not the cinematography that made it worth $7 to me, but the fact that purchasing it supports roller derby. I was pretty impressed with the creativity, energy, and team-building that I saw both at my daughter's practice and at the actual event. I didn't see much of the adult league match (a hometown contest between the Farm Fatales and the Slaughter Scouts) because I got drafted for a shift in the concession stand, but I came away with both a lot of positive feelings and substantial curiosity about roller derby.  As best I can tell, we're now in at least the fourth or fifth generation of popularity of roller derby. There's a really interesting history as to how this activity has changed over the decades as its popularity has cyclically risen and fallen.  I'm not anywhere close to understanding it, but it's fascinating. And it's also got me pondering why and under what circumstances we sometimes (but not always) describe cultural/technological change as "generational."  It seems like identifying "generations" is kind of a real-time way of temporal typologizing (imposing nominal categories on more-or-less continuous variation). We do it for fighter aircraft and roller derby, but not for basketball and cars.

PictureLead ball fired from a colonial era Charleville or Brown Bess musket.
The Siege of Fort Motte and the Carolina Spring

I spent Friday working with Steve Smith (Director of SCIAA) and two volunteers on a survey at Fort Motte, site of a Revolutionary War siege and battle. There is a lot of interesting historic period archaeology here, and going out with Steve was a nice opportunity to participate and learn something new. Steve and Jim Legg are using systematic metal detecting survey, among other things, to try to pin down where on the landscape various parts of the Fort Motte story unfolded.  Yesterday we were working in the general area where some of the Patriot forces would have been camped during the siege. We found several good colonial-period artifacts (e.g., a musket ball, cast iron kettle fragments, and a brass finial probably from a flag or spontoon), I got some experience using a metal detector, and had a good time talking with the volunteers. I also saw the first dragonfly I've seen so far this year, and got to complain about the early March heat. It really is a different world down here as far as the weather.  I'm going to need to hustle if I'm going to get any of my own fieldwork going before the spring explosion of plant growth makes things like long distance total station work impossible.

Swordgate: Is the Fifteenth of Nevuary Finally Upon Us?

Various promises and hints about the release of the 200-page paper that will present the case for the "Roman sword from Nova Scotia" have yet to turn into anything tangible, and I've stopped paying attention. The last I heard (weeks ago), at that was left to prepare the document was completion of spell check.  The "just around the corner" nonsense is boring. Somebody please wake me up if the paper ever materializes.
<<Previous
Forward>>

    All views expressed in my blog posts are my own. The views of those that comment are their own. That's how it works.

    I reserve the right to take down comments that I deem to be defamatory or harassing. 

    Andy White

    Email me: [email protected]

    Enter your email address:

    Delivered by FeedBurner


    Picture

    Sick of the woo?  Want to help keep honest and open dialogue about pseudo-archaeology on the internet? Please consider contributing to Woo War Two.
    Picture

    Follow updates on posts related to giants on the Modern Mythology of Giants page on Facebook.

    Archives

    May 2024
    January 2024
    January 2023
    January 2022
    November 2021
    September 2021
    August 2021
    March 2021
    June 2020
    April 2020
    March 2020
    January 2020
    December 2019
    November 2019
    October 2019
    September 2019
    May 2019
    April 2019
    January 2019
    December 2018
    November 2018
    October 2018
    September 2018
    August 2018
    July 2018
    June 2018
    May 2018
    April 2018
    March 2018
    February 2018
    January 2018
    December 2017
    November 2017
    October 2017
    September 2017
    August 2017
    July 2017
    June 2017
    May 2017
    April 2017
    March 2017
    February 2017
    January 2017
    December 2016
    November 2016
    October 2016
    September 2016
    August 2016
    July 2016
    June 2016
    May 2016
    April 2016
    March 2016
    February 2016
    January 2016
    December 2015
    November 2015
    October 2015
    September 2015
    August 2015
    July 2015
    June 2015
    May 2015
    April 2015
    March 2015
    February 2015
    January 2015
    December 2014
    November 2014
    September 2014
    August 2014
    June 2014
    May 2014
    April 2014
    March 2014

    Categories

    All
    3D Models
    AAA
    Adena
    Afrocentrism
    Agent Based Modeling
    Agent-based Modeling
    Aircraft
    Alabama
    Aliens
    Ancient Artifact Preservation Society
    Androgynous Fish Gods
    ANTH 227
    ANTH 291
    ANTH 322
    Anthropology History
    Anunnaki
    Appalachia
    Archaeology
    Ardipithecus
    Art
    Atlantis
    Australia
    Australopithecines
    Aviation History
    Bigfoot
    Birds
    Boas
    Book Of Mormon
    Broad River Archaeological Field School
    Bronze Age
    Caribou
    Carolina Bays
    Ceramics
    China
    Clovis
    Complexity
    Copper Culture
    Cotton Mather
    COVID-19
    Creationism
    Croatia
    Crow
    Demography
    Denisovans
    Diffusionism
    DINAA
    Dinosaurs
    Dirt Dance Floor
    Double Rows Of Teeth
    Dragonflies
    Early Archaic
    Early Woodland
    Earthworks
    Eastern Woodlands
    Eastern Woodlands Household Archaeology Data Project
    Education
    Egypt
    Europe
    Evolution
    Ewhadp
    Fake Hercules Swords
    Fetal Head Molding
    Field School
    Film
    Florida
    Forbidden Archaeology
    Forbidden History
    Four Field Anthropology
    Four-field Anthropology
    France
    Genetics
    Genus Homo
    Geology
    Geometry
    Geophysics
    Georgia
    Giants
    Giants Of Olden Times
    Gigantism
    Gigantopithecus
    Graham Hancock
    Grand Valley State
    Great Lakes
    Hollow Earth
    Homo Erectus
    Hunter Gatherers
    Hunter-gatherers
    Illinois
    India
    Indiana
    Indonesia
    Iowa
    Iraq
    Israel
    Jim Vieira
    Jobs
    Kensington Rune Stone
    Kentucky
    Kirk Project
    Late Archaic
    Lemuria
    Lithic Raw Materials
    Lithics
    Lizard Man
    Lomekwi
    Lost Continents
    Mack
    Mammoths
    Mastodons
    Maya
    Megafauna
    Megaliths
    Mesolithic
    Michigan
    Middle Archaic
    Middle Pleistocene
    Middle Woodland
    Midwest
    Minnesota
    Mississippi
    Mississippian
    Missouri
    Modeling
    Morphometric
    Mound Builder Myth
    Mu
    Music
    Nazis
    Neandertals
    Near East
    Nephilim
    Nevada
    New Mexico
    Newspapers
    New York
    North Carolina
    Oahspe
    Oak Island
    Obstetrics
    Ohio
    Ohio Valley
    Oldowan
    Olmec
    Open Data
    Paleoindian
    Paleolithic
    Pilumgate
    Pleistocene
    Pliocene
    Pre Clovis
    Pre-Clovis
    Prehistoric Families
    Pseudo Science
    Pseudo-science
    Radiocarbon
    Reality Check
    Rome
    Russia
    SAA
    Sardinia
    SCIAA
    Science
    Scientific Racism
    Sculpture
    SEAC
    Search For The Lost Giants
    Sexual Dimorphism
    Sitchin
    Social Complexity
    Social Networks
    Solutrean Hypothesis
    South Africa
    South America
    South Carolina
    Southeast
    Stone Holes
    Subsistence
    Swordgate
    Teaching
    Technology
    Teeth
    Television
    Tennessee
    Texas
    Topper
    Travel
    Travel Diaries
    Vaccines
    Washington
    Whatzit
    White Supremacists
    Wisconsin
    Woo War Two
    World War I
    World War II
    Writing
    Younger Dryas

    RSS Feed

    Picture
Proudly powered by Weebly